Lab Publication - Current Protocols
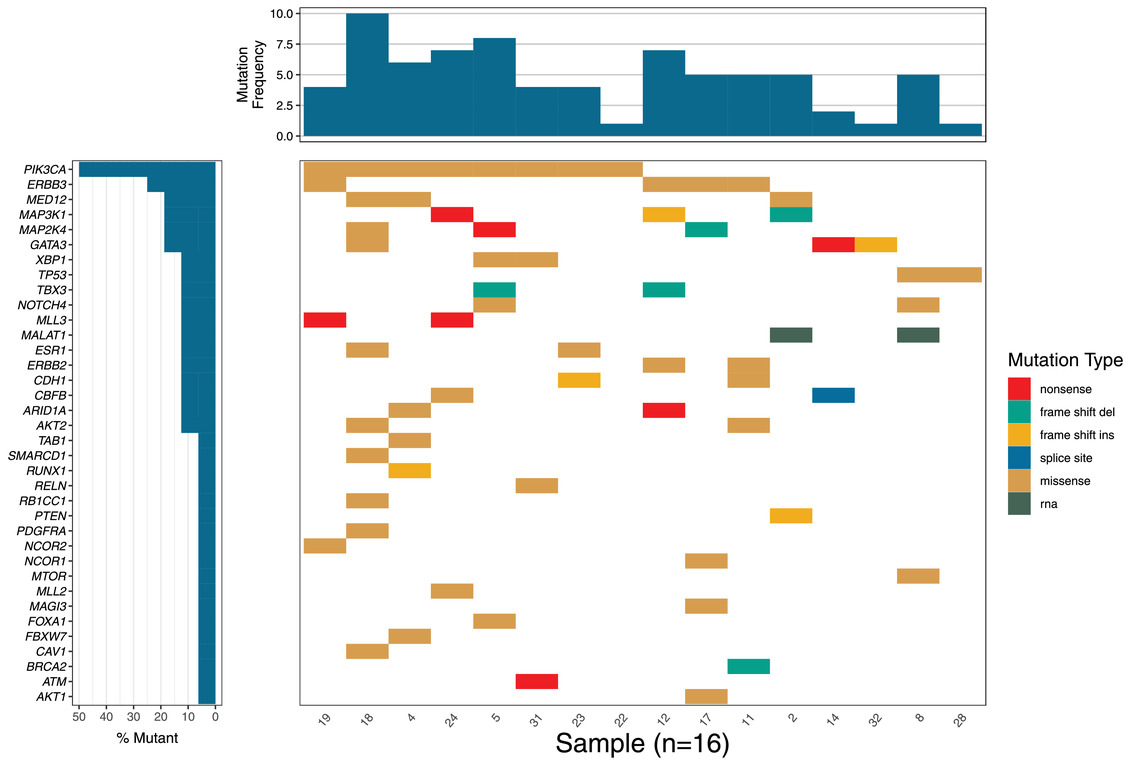
The creation of visualizations to interpret genomics data remains an important aspect of data science within computational biology. The GenVisR Bioconductor package was created to lower the entry point for publication-quality graphics and has remained a popular suite of tools within this domain. GenVisR supports visualizations covering a breadth of topics including functions to produce visual summaries of copy-number alterations, somatic variants, sequence quality metrics, and more. Recently, the GenVisR package has undergone significant updates to increase performance and functionality. To demonstrate the utility of GenVisR, we present protocols for use of the updated Waterfall() function to create a customizable Oncoprint-style plot of the mutational landscape of a tumor cohort. We explain the basics of installation, data import, configuration, plotting, clinical annotation, and customization. A companion online workshop describing the GenVisR library, Waterfall() function, and other genomic visualization tools is available at genviz.org. © 2021 The Authors. Current Protocols published by Wiley Periodicals LLC. Basic Protocol 1: Generating a Waterfall() plot from original mutation data Basic Protocol 2: Adding clinical data to a Waterfall() plot Basic Protocol 3: Customizing mutation burden in Waterfall() plots Basic Protocol 4: Brief exploration of customizable options Support Protocol 1: Installing GenVisR.

Read the paper: Current Protocols
